Performance over the last 10 years
Over the last ten years, the group’s revenues doubled with solid growth in the k-light component. Loan book and funding increased significantly and now are more diversified.
The excellent performances over the last 10 years are the result of the process, launched in 2003, of in-depth evolution of Mediobanca, which transformed the group from a holding company to a highly specialised financial operator, with higher focus on k-light activities.Performance over the last 10 years
Revenues doubled 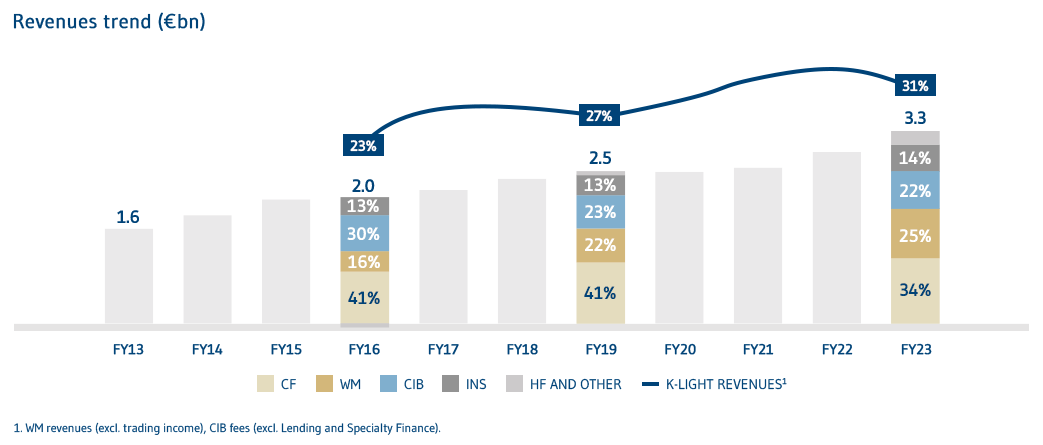
Increasing focus on K-Light businesses 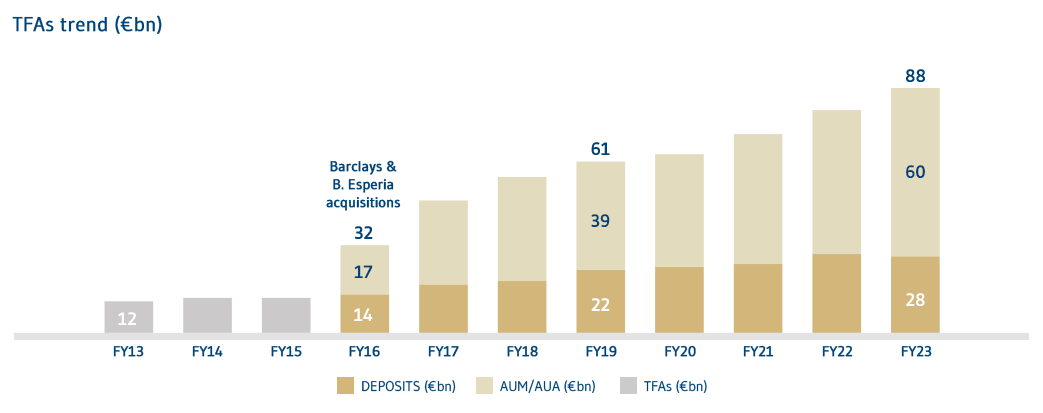
Value-driven asset growth 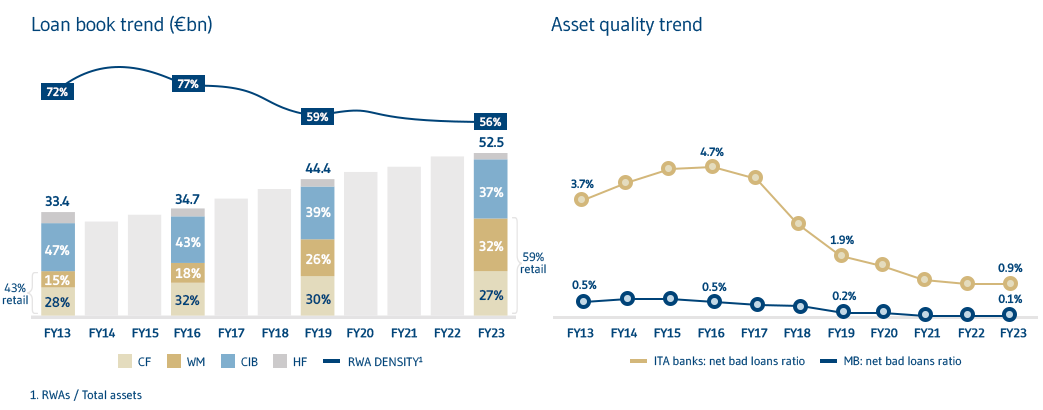
Ample and diversified funding 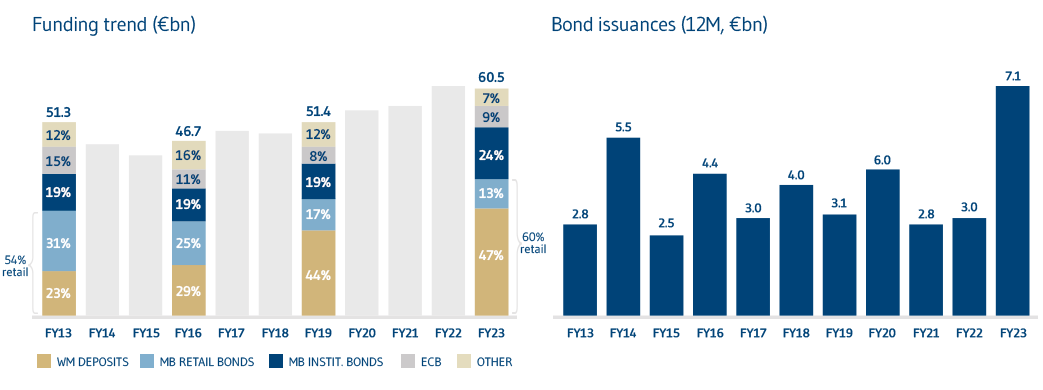
Increase in earnings, profitability and capital 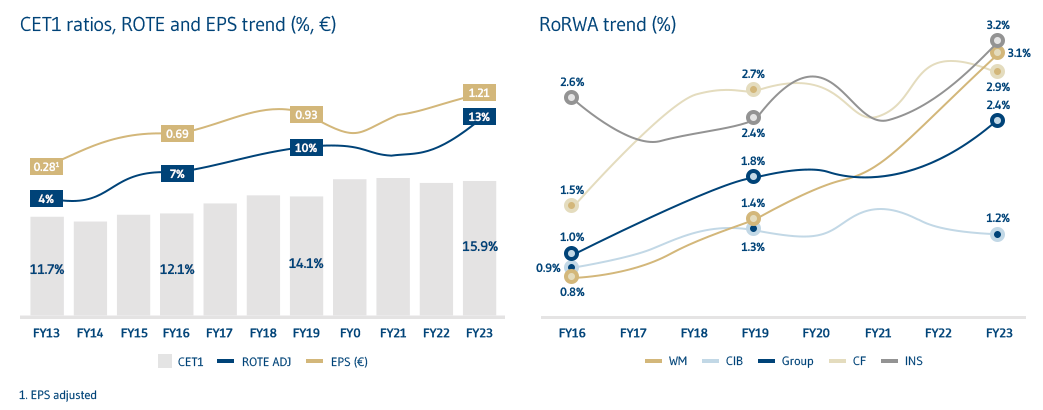
Strong returns to our Shareholders 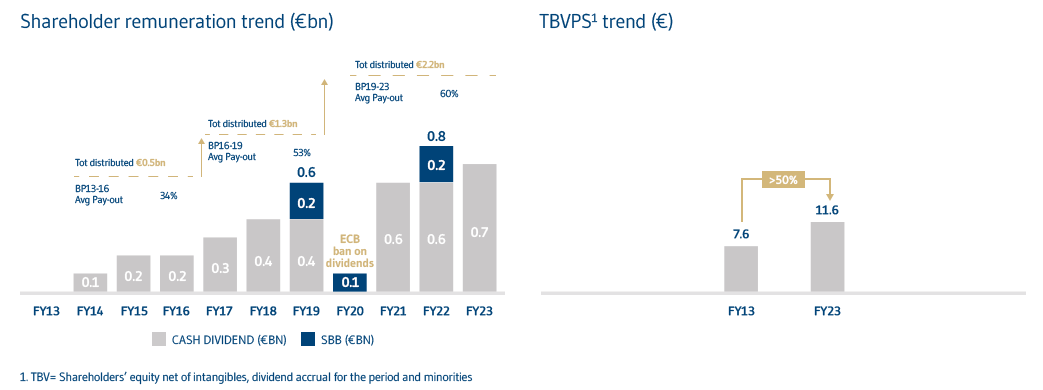
| (€M) | JUN14 | JUN15 | JUN16 | JUN17 | JUN18 | JUN19 | JUN20 | JUN21 | JUN22 | JUN23 | JUN24 |
| NET INTEREST INCOME | 1087 | 1143 | 1207 | 1288 | 1359 | 1396 | 1442 | 1415 | 1479 | 1801 | 1985 |
| NET TREASURY INCOME | 45 | 207 | 133 | 121 | 157 | 197 | 136 | 197 | 162 | 206 | 172 |
| NET FEE INCOME | 424 | 472 | 450 | 523 | 622 | 611 | 630 | 745 | 851 | 844 | 939 |
| EQUITY-ACCOUNTED COMPANIES | 264 | 224 | 257 | 264 | 280 | 321 | 304 | 272 | 359 | 454 | 510 |
| TOTAL INCOME | 1819 | 2045 | 2047 | 2196 | 2419 | 2525 | 2513 | 2628 | 2851 | 3305 | 3607 |
| OPERATING COSTS | -791 | -847 | -892 | -1024 | -1115 | -1162 | -1189 | -1238 | -1312 | -1413 | -1542 |
| LOAN LOSS PROVISIONS | -736 | -533 | -419 | -317 | -247 | -223 | -375 | -249 | -243 | -270 | -252 |
| OPERATING PROFIT | 292 | 666 | 736 | 855 | 1057 | 1140 | 949 | 1142 | 1296 | 1621 | 1813 |
| OTHER INCOME (LOSSES) | 209 | 92 | 1 | 59 | 39 | -56 | -154 | -37 | -127 | -193 | -76 |
| PROFIT BEFORE TAX | 501 | 757 | 736 | 914 | 1096 | 1084 | 795 | 1104 | 1169 | 1428 | 1736 |
| NET PROFIT | 465 | 590 | 605 | 750 | 864 | 823 | 600 | 808 | 907 | 1027 | 1273 |
| (€M) | JUN.14 | JUN.15 | JUN.16 | JUN.17 | JUN.18 | JUN.19 | JUN.20 | JUN.21 | JUN.22 | JUN.23 | JUN.24 |
| NET INTEREST INCOME | 1087 | 1143 | 1207 | 1288 | 1359 | 1396 | 1442 | 1415 | 1479 | 1801 | 1985 |
| NET TREASURY INCOME | 45 | 207 | 133 | 121 | 157 | 197 | 136 | 197 | 162 | 206 | 172 |
| NET FEE INCOME | 424 | 472 | 450 | 523 | 622 | 611 | 630 | 745 | 851 | 844 | 939 |
| EQUITY-ACCOUNTED COMPANIES | 264 | 224 | 257 | 264 | 280 | 321 | 304 | 272 | 359 | 454 | 510 |
| TOTAL INCOME | 1819 | 2045 | 2047 | 2196 | 2419 | 2525 | 2513 | 2628 | 2851 | 3305 | 3607 |
| OPERATING COSTS | -791 | -847 | -892 | -1024 | -1115 | -1162 | -1189 | -1238 | -1312 | -1413 | -1542 |
| LOAN LOSS PROVISIONS | -736 | -533 | -419 | -317 | -247 | -223 | -375 | -249 | -243 | -270 | -252 |
| OPERATING PROFIT | 292 | 666 | 736 | 855 | 1057 | 1140 | 949 | 1142 | 1296 | 1621 | 1813 |
| OTHER INCOME (LOSSES) | 209 | 92 | 1 | 59 | 39 | -56 | -154 | -37 | -127 | -193 | -76 |
| PROFIT BEFORE TAX | 501 | 757 | 736 | 914 | 1096 | 1084 | 795 | 1104 | 1169 | 1428 | 1736 |
| NET PROFIT | 465 | 590 | 605 | 750 | 864 | 823 | 600 | 808 | 907 | 1027 | 1273 |
| 0 | JUN14 | JUN15 | JUN16 | JUN17 | JUN18 | JUN19 | JUN20 | JUN21 | JUN22 | JUN23 | JUN24 |
| TREASURY, AFS AND HTM | 19789 | 14777 | 16322 | 16455 | 13327 | 12734 | 13760 | 14418 | 16685 | 16293 | 18677 |
| EQUITY INVESTMENTS | 2871 | 3411 | 3163 | 3037 | 3211 | 3260 | 3205 | 3703 | 3158 | 3564 | 3789 |
| LOANS TO CUSTOMERS | 30552 | 32890 | 34739 | 38191 | 41128 | 44394 | 46685 | 48414 | 51701 | 52549 | 52447 |
| FUNDING | 45834 | 42711 | 46658 | 49121 | 46893 | 51393 | 54917 | 56156 | 61169 | 60506 | 63670 |
| SHAREHOLDERS’ EQUITY | 7373 | 8169 | 8922 | 9192 | 9732 | 9899 | 9740 | 11101 | 10749 | 11429 | 11243 |
| RWAS | 58744 | 59577 | 53862 | 52709 | 47363 | 46310 | 48030 | 47159 | 50378 | 51432 | 47622 |
| NO. OF STAFF | 3570 | 3790 | 4036 | 4798 | 4717 | 4805 | 4920 | 4921 | 5016 | 5227 | 5443 |
| CT1 RATIO (%) | 11,1 | 12 | 12,1 | 13,3 | 14,2 | 14,1 | 16,1 | 16,3 | 15,7 | 15,9 | 15,2 |
| COST/INCOME RATIO (%) | 43 | 41 | 44 | 47 | 46 | 46 | 47 | 47 | 46 | 43 | 43 |
| COST OF RISK (BPS) | 230 | 168 | 124 | 87 | 62 | 52 | 82 | 52 | 48 | 52 | 48 |
| JUN.14 | JUN.15 | JUN.16 | JUN.17 | JUN.18 | JUN.19 | JUN.20 | JUN.21 | JUN.22 | JUN.23 | JUN.24 | |
| TREASURY, AFS AND HTM | 19789 | 14777 | 16322 | 16455 | 13327 | 12734 | 13760 | 14418 | 16685 | 16293 | 18677 |
| EQUITY INVESTMENTS | 2871 | 3411 | 3163 | 3037 | 3211 | 3260 | 3205 | 3703 | 3158 | 3564 | 3789 |
| LOANS TO CUSTOMERS | 30552 | 32890 | 34739 | 38191 | 41128 | 44394 | 46685 | 48414 | 51701 | 52549 | 52447 |
| FUNDING | 45834 | 42711 | 46658 | 49121 | 46893 | 51393 | 54917 | 56156 | 61169 | 60506 | 63670 |
| SHAREHOLDERS’ EQUITY | 7373 | 8169 | 8922 | 9192 | 9732 | 9899 | 9740 | 11101 | 10749 | 11429 | 11243 |
| RWAS | 58744 | 59577 | 53862 | 52709 | 47363 | 46310 | 48030 | 47159 | 50378 | 51432 | 47622 |
| NO. OF STAFF | 3570 | 3790 | 4036 | 4798 | 4717 | 4805 | 4920 | 4921 | 5016 | 5227 | 5443 |
| CT1 RATIO (%) | 11,1 | 12 | 12,1 | 13,3 | 14,2 | 14,1 | 16,1 | 16,3 | 15,7 | 15,9 | 15,2 |
| COST/INCOME RATIO (%) | 43 | 41 | 44 | 47 | 46 | 46 | 47 | 47 | 46 | 43 | 43 |
| COST OF RISK (BPS) | 230 | 168 | 124 | 87 | 62 | 52 | 82 | 52 | 48 | 52 | 48 |
- In the last decade we have doubled our revenues to €3.6bn, consistently achieving our targets
- All business segments have been enlarged, contributing positively to growth and profitability
- Revenue quality enhanced by broader diversification and growing contribution from capital-light activities
- Since 2016, when Mediobanca effectively entered in the WM business, TFAs have tripled (to approx. €100bn) due to MB Private-Investment Banking model adoption, and significant investment in distribution and acquisitions
- In the last 10Y MB loan book increased by more than €20bn to €52bn, becoming more diversified with a higher retail share from 49% to 61% (increased mainly in WM)
- RWA density reduced from 83% to 48% due to ongoing capital absorption optimization mainly in CIB
- The selective and value-driven approach that has always characterized our loan origination policy allowed to maintain a
healthy and best-in-class asset quality, without recurring to any large NPL disposal
- In the last decade Group funding increased by almost €20bn to €64bn, backed by solid WM deposits growth whose contribution to Group funding almost doubled from 25% to 44%
- Access to bond market has always been wide even during crisis periods, with a mix that has evolved over time in favour of the institutional component
- Reliance on ECB funding has always been contained and reduced to 2% of Group funding as at June 2024
- Capital generation has enabled solid CET1 ratios, without capital increases
- Earnings per share increased steadily due to a combination of organic growth, acquisitions and share buybacks
- Profitability ramped up sustainably, mainly driven by WM
- Shareholder remuneration increased to 85% total payout in FY24
- Over €5bn distributed in last 10Y, of which €1.1bn in the first year of BP23-26 (which envisages a cumulated distribution of €3.7bn in 3Y)
- In the last decade tangible book value per share has also increased by 37% to €11.6