The excellent performances over the last 10 years are the result of the process, launched in 2003, of in-depth evolution of Mediobanca, which transformed the group from a holding company to a highly specialised financial operator, with higher focus on k-light activities.
| (€M) |
JUN14 |
JUN15 |
JUN16 |
JUN17 |
JUN18 |
JUN19 |
JUN20 |
JUN21 |
JUN22 |
JUN23 |
JUN24 |
| NET INTEREST INCOME |
1087 |
1143 |
1207 |
1288 |
1359 |
1396 |
1442 |
1415 |
1479 |
1801 |
1985 |
| NET TREASURY INCOME |
45 |
207 |
133 |
121 |
157 |
197 |
136 |
197 |
162 |
206 |
172 |
| NET FEE INCOME |
424 |
472 |
450 |
523 |
622 |
611 |
630 |
745 |
851 |
844 |
939 |
| EQUITY-ACCOUNTED COMPANIES |
264 |
224 |
257 |
264 |
280 |
321 |
304 |
272 |
359 |
454 |
510 |
| TOTAL INCOME |
1819 |
2045 |
2047 |
2196 |
2419 |
2525 |
2513 |
2628 |
2851 |
3305 |
3607 |
| OPERATING COSTS |
-791 |
-847 |
-892 |
-1024 |
-1115 |
-1162 |
-1189 |
-1238 |
-1312 |
-1413 |
-1542 |
| LOAN LOSS PROVISIONS |
-736 |
-533 |
-419 |
-317 |
-247 |
-223 |
-375 |
-249 |
-243 |
-270 |
-252 |
| OPERATING PROFIT |
292 |
666 |
736 |
855 |
1057 |
1140 |
949 |
1142 |
1296 |
1621 |
1813 |
| OTHER INCOME (LOSSES) |
209 |
92 |
1 |
59 |
39 |
-56 |
-154 |
-37 |
-127 |
-193 |
-76 |
| PROFIT BEFORE TAX |
501 |
757 |
736 |
914 |
1096 |
1084 |
795 |
1104 |
1169 |
1428 |
1736 |
| NET PROFIT |
465 |
590 |
605 |
750 |
864 |
823 |
600 |
808 |
907 |
1027 |
1273 |
| (€M) |
JUN.14 |
JUN.15 |
JUN.16 |
JUN.17 |
JUN.18 |
JUN.19 |
JUN.20 |
JUN.21 |
JUN.22 |
JUN.23 |
JUN.24 |
| NET INTEREST INCOME |
1087 |
1143 |
1207 |
1288 |
1359 |
1396 |
1442 |
1415 |
1479 |
1801 |
1985 |
| NET TREASURY INCOME |
45 |
207 |
133 |
121 |
157 |
197 |
136 |
197 |
162 |
206 |
172 |
| NET FEE INCOME |
424 |
472 |
450 |
523 |
622 |
611 |
630 |
745 |
851 |
844 |
939 |
| EQUITY-ACCOUNTED COMPANIES |
264 |
224 |
257 |
264 |
280 |
321 |
304 |
272 |
359 |
454 |
510 |
| TOTAL INCOME |
1819 |
2045 |
2047 |
2196 |
2419 |
2525 |
2513 |
2628 |
2851 |
3305 |
3607 |
| OPERATING COSTS |
-791 |
-847 |
-892 |
-1024 |
-1115 |
-1162 |
-1189 |
-1238 |
-1312 |
-1413 |
-1542 |
| LOAN LOSS PROVISIONS |
-736 |
-533 |
-419 |
-317 |
-247 |
-223 |
-375 |
-249 |
-243 |
-270 |
-252 |
| OPERATING PROFIT |
292 |
666 |
736 |
855 |
1057 |
1140 |
949 |
1142 |
1296 |
1621 |
1813 |
| OTHER INCOME (LOSSES) |
209 |
92 |
1 |
59 |
39 |
-56 |
-154 |
-37 |
-127 |
-193 |
-76 |
| PROFIT BEFORE TAX |
501 |
757 |
736 |
914 |
1096 |
1084 |
795 |
1104 |
1169 |
1428 |
1736 |
| NET PROFIT |
465 |
590 |
605 |
750 |
864 |
823 |
600 |
808 |
907 |
1027 |
1273 |
| 0 |
JUN14 |
JUN15 |
JUN16 |
JUN17 |
JUN18 |
JUN19 |
JUN20 |
JUN21 |
JUN22 |
JUN23 |
JUN24 |
| TREASURY, AFS AND HTM |
19789 |
14777 |
16322 |
16455 |
13327 |
12734 |
13760 |
14418 |
16685 |
16293 |
18677 |
| EQUITY INVESTMENTS |
2871 |
3411 |
3163 |
3037 |
3211 |
3260 |
3205 |
3703 |
3158 |
3564 |
3789 |
| LOANS TO CUSTOMERS |
30552 |
32890 |
34739 |
38191 |
41128 |
44394 |
46685 |
48414 |
51701 |
52549 |
52447 |
| FUNDING |
45834 |
42711 |
46658 |
49121 |
46893 |
51393 |
54917 |
56156 |
61169 |
60506 |
63670 |
| SHAREHOLDERS’ EQUITY |
7373 |
8169 |
8922 |
9192 |
9732 |
9899 |
9740 |
11101 |
10749 |
11429 |
11243 |
| RWAS |
58744 |
59577 |
53862 |
52709 |
47363 |
46310 |
48030 |
47159 |
50378 |
51432 |
47622 |
| NO. OF STAFF |
3570 |
3790 |
4036 |
4798 |
4717 |
4805 |
4920 |
4921 |
5016 |
5227 |
5443 |
| CT1 RATIO (%) |
11,1 |
12 |
12,1 |
13,3 |
14,2 |
14,1 |
16,1 |
16,3 |
15,7 |
15,9 |
15,2 |
| COST/INCOME RATIO (%) |
43 |
41 |
44 |
47 |
46 |
46 |
47 |
47 |
46 |
43 |
43 |
| COST OF RISK (BPS) |
230 |
168 |
124 |
87 |
62 |
52 |
82 |
52 |
48 |
52 |
48 |
| |
JUN.14 |
JUN.15 |
JUN.16 |
JUN.17 |
JUN.18 |
JUN.19 |
JUN.20 |
JUN.21 |
JUN.22 |
JUN.23 |
JUN.24 |
| TREASURY, AFS AND HTM |
19789 |
14777 |
16322 |
16455 |
13327 |
12734 |
13760 |
14418 |
16685 |
16293 |
18677 |
| EQUITY INVESTMENTS |
2871 |
3411 |
3163 |
3037 |
3211 |
3260 |
3205 |
3703 |
3158 |
3564 |
3789 |
| LOANS TO CUSTOMERS |
30552 |
32890 |
34739 |
38191 |
41128 |
44394 |
46685 |
48414 |
51701 |
52549 |
52447 |
| FUNDING |
45834 |
42711 |
46658 |
49121 |
46893 |
51393 |
54917 |
56156 |
61169 |
60506 |
63670 |
| SHAREHOLDERS’ EQUITY |
7373 |
8169 |
8922 |
9192 |
9732 |
9899 |
9740 |
11101 |
10749 |
11429 |
11243 |
| RWAS |
58744 |
59577 |
53862 |
52709 |
47363 |
46310 |
48030 |
47159 |
50378 |
51432 |
47622 |
| NO. OF STAFF |
3570 |
3790 |
4036 |
4798 |
4717 |
4805 |
4920 |
4921 |
5016 |
5227 |
5443 |
| CT1 RATIO (%) |
11,1 |
12 |
12,1 |
13,3 |
14,2 |
14,1 |
16,1 |
16,3 |
15,7 |
15,9 |
15,2 |
| COST/INCOME RATIO (%) |
43 |
41 |
44 |
47 |
46 |
46 |
47 |
47 |
46 |
43 |
43 |
| COST OF RISK (BPS) |
230 |
168 |
124 |
87 |
62 |
52 |
82 |
52 |
48 |
52 |
48 |
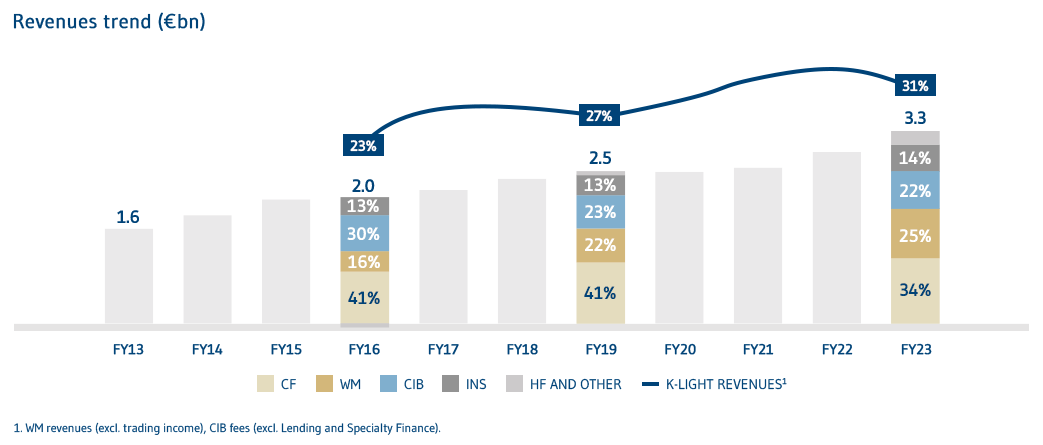
- In the last decade we have doubled our revenues to €3.6bn, consistently achieving our targets
- All business segments have been enlarged, contributing positively to growth and profitability
- Revenue quality enhanced by broader diversification and growing contribution from capital-light activities
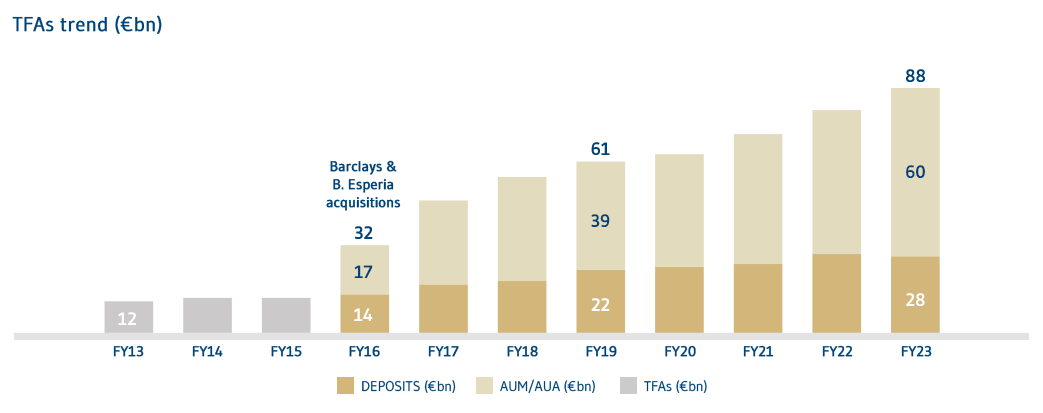
- Since 2016, when Mediobanca effectively entered in the WM business, TFAs have tripled (to approx. €100bn) due to MB Private-Investment Banking model adoption, and significant investment in distribution and acquisitions
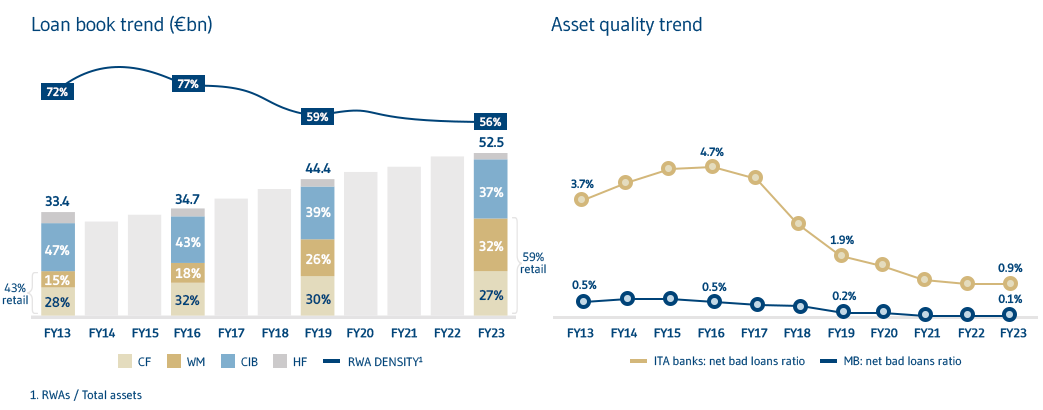
- In the last 10Y MB loan book increased by more than €20bn to €52bn, becoming more diversified with a higher retail share from 49% to 61% (increased mainly in WM)
- RWA density reduced from 83% to 48% due to ongoing capital absorption optimization mainly in CIB
- The selective and value-driven approach that has always characterized our loan origination policy allowed to maintain a
healthy and best-in-class asset quality, without recurring to any large NPL disposal
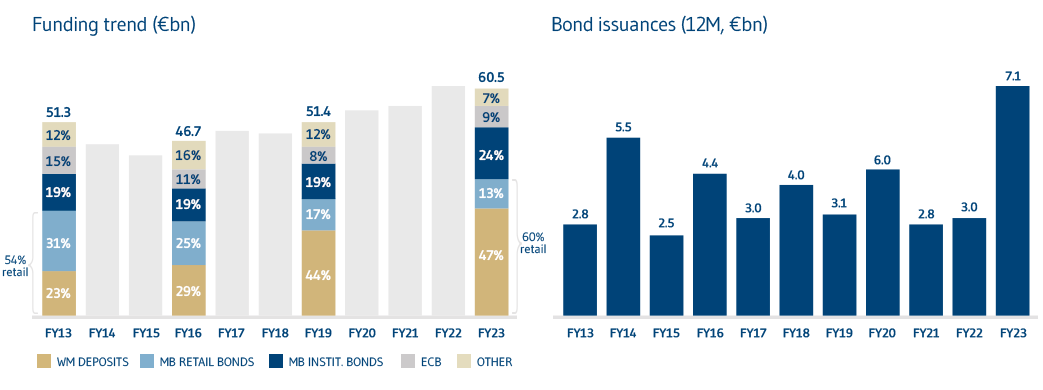
- In the last decade Group funding increased by almost €20bn to €64bn, backed by solid WM deposits growth whose contribution to Group funding almost doubled from 25% to 44%
- Access to bond market has always been wide even during crisis periods, with a mix that has evolved over time in favour of the institutional component
- Reliance on ECB funding has always been contained and reduced to 2% of Group funding as at June 2024
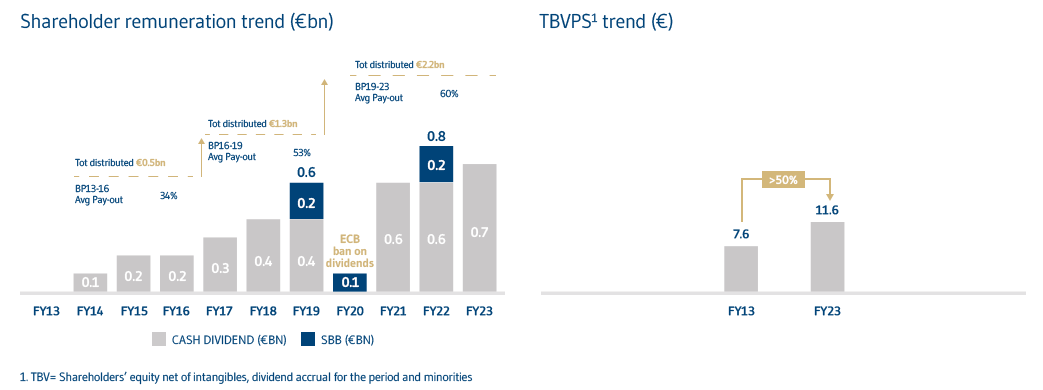
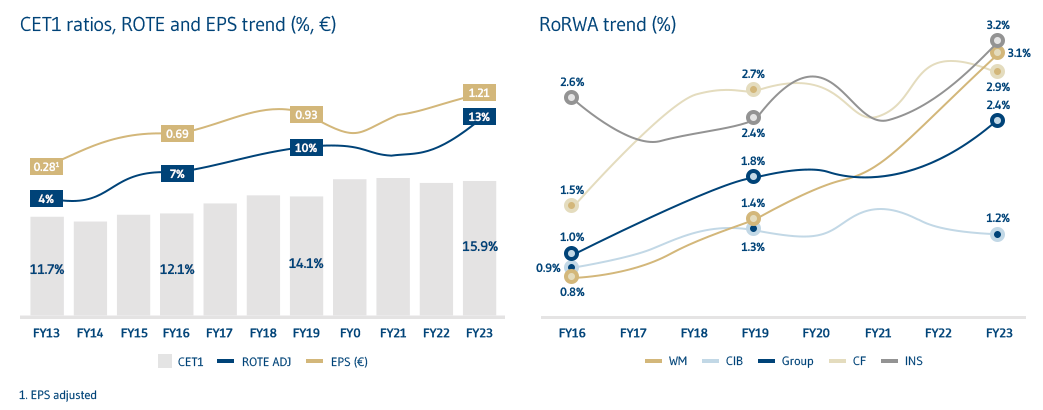
- Capital generation has enabled solid CET1 ratios, without capital increases
- Earnings per share increased steadily due to a combination of organic growth, acquisitions and share buybacks
- Profitability ramped up sustainably, mainly driven by WM
- Shareholder remuneration increased to 85% total payout in FY24
- Over €5bn distributed in last 10Y, of which €1.1bn in the first year of BP23-26 (which envisages a cumulated distribution of €3.7bn in 3Y)
- In the last decade tangible book value per share has also increased by 37% to €11.6